BBC Weather Watchers
BBC's first experiment in the crowdsourcing space saw the broadcaster create a 130.000 strong community helping report local weather events.
Launched in Autumn 2015, Weather Watchers is the BBC first experiment on crowdsourcing. Weather is an obsession for many in the UK and the BBC receives daily spontaneous contributions by their audience to their reporting. There was a clear opportunity to respond to and leverage these contributions by opening up a space for these reports to be submitted and surfaced to every one.
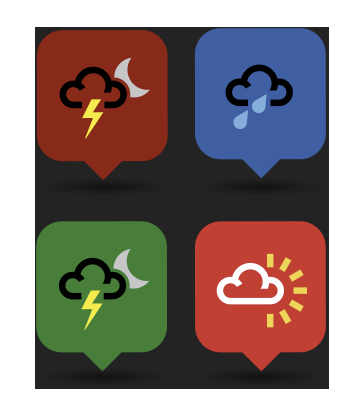
More than that, the BBC created a constant stream of high quality, up-to-the hour weather imagery to illustrate their weather reports. While the weather can for the most part not feel the most exciting of subjects, it is in specific weather events that such a tool becomes a true journalistic resource, tracking and illustrating events like storms, snowfall gets a massive boost from what is known as nowcasting (yes, it is a thing, I didn't know it either).
The challenges
Service integration
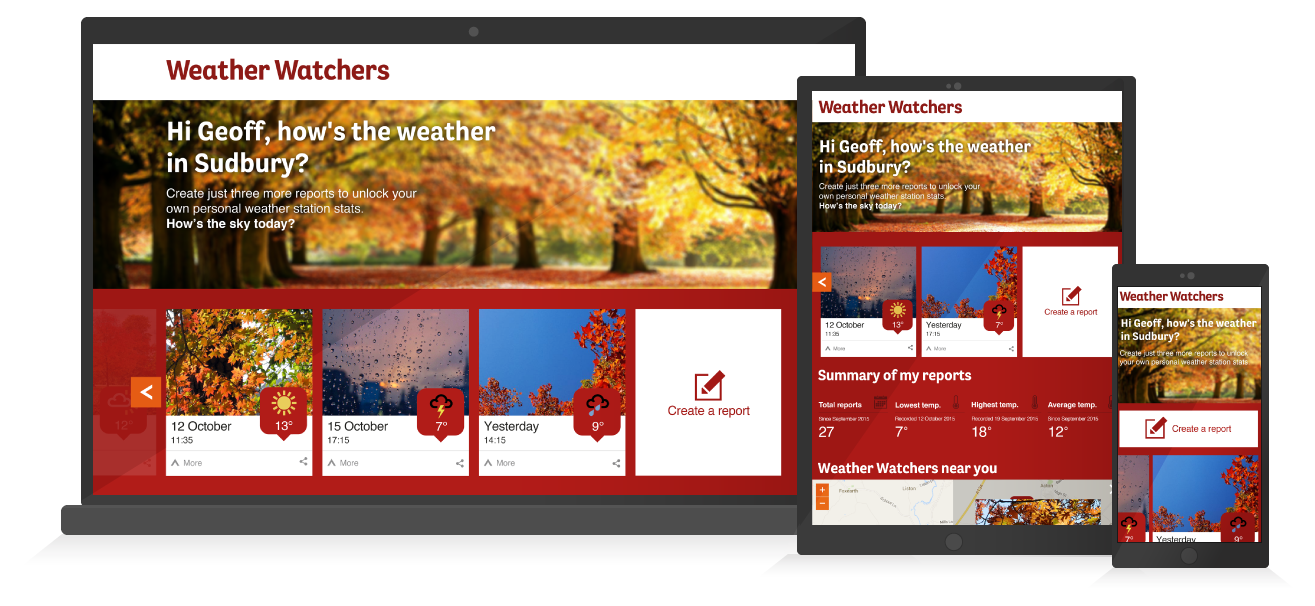
To bring this together, we had to connect several different services, from the BBC as well from external suppliers. The main interface would be displayed on top of Google Maps, but before getting there, we needed to integrate BBC's sign in system (BBC ID), an image upload tool that would pre-filter out faces and finally, implement pre and post moderation.
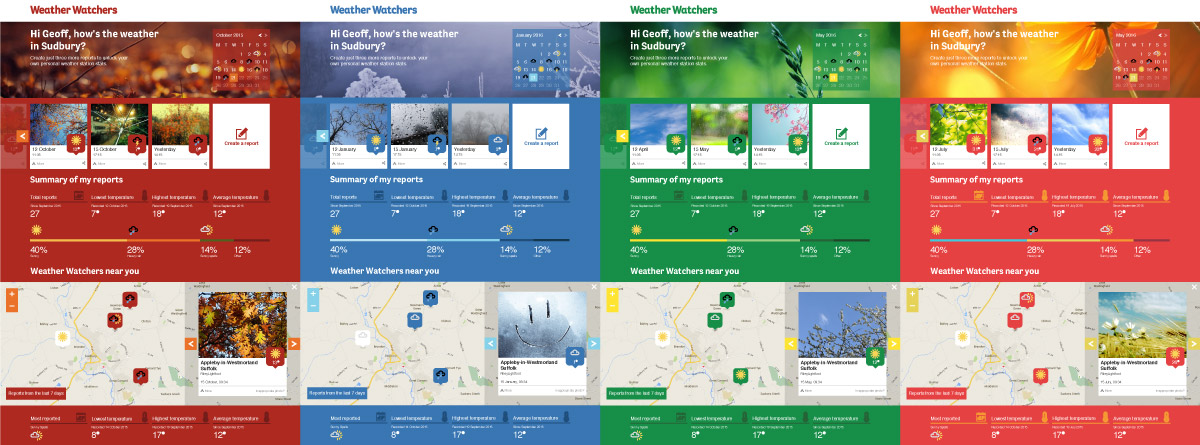
Four seasonal visuals
One of the key propositions of the project was that it would reflect the changes in seasons not only through photos but also through its own appearance. This meant an interface that could be changed with the switch of a few parameters.
Spread teams
Besides myself being brought in as a Lead UX designer such effort meant a big increase on the dev team which meant working with an outside supplier for coding parts of the front and back end. In the end we were some 8-10 people working
across 4 different locations across the UK, from Cardiff to Brighton via London.
Timeline
What made this project especially challenging is that it had a tight timescale and a hard deadline. The project was connected with BBC's Make it Digital initiative, and this meant a launch date of October. In total, the project would have to go from the stage of proof of concept to launch is just over 12 weeks.
The Process
Taking this project from initial exploration to launch required the use of different skills at each stage, starting from project planning and ending at UAT & handover documentation.
Understanding the proposition
Quickly investigation of the proposition by reading through available records (presentations, email trail, etc) and speaking to key stakeholders. This "couple of days" cycle culminated with a play back meeting with the head of UX for News and Weather where we aligned on direction, key points of action and a first discussion about the possibilities for Weather Watchers.
Take Stock of UX work to date
Arriving at the project, there existed a proof of concept work had been produced by an agency. It was a hybrid between wireframes and visual design that unfortunately in trying to do both did not fully achieve a good result in neither.
First thing to do therefore was to revisit the work, interrogating its UX and identifying opportunities for improvement as well as gaps that needed to be filled.
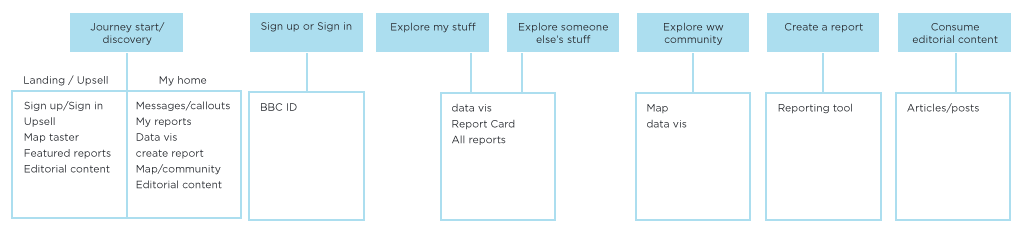
Out of this we extracted the key moments of the experience, discussed what we'd like an MVP to be like and from there I created a first flow and set of page or module types that would serve as base for the plan of action to come.
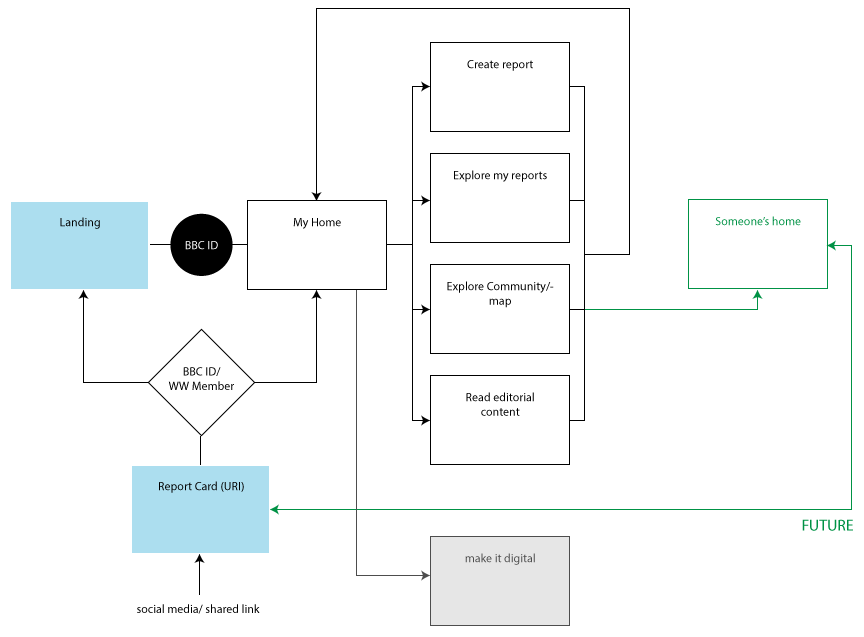
Work plan
Due to the tight timeline it was clear that to a certain extent, design and development would have to run in parallel, which meant that we needed to be creative in the delivery. Devs were to code from high fidelity wireframes which should take the structure to some 80-90% of what the final visual designs would be. The idea was to give the devs something to code with in the first opportunity and make some leeway, being some 10 days ahead of current dev sprints.
There would be some inevitable re-work but we could not afford the luxury to go to a more comfortable waterfall cycle.
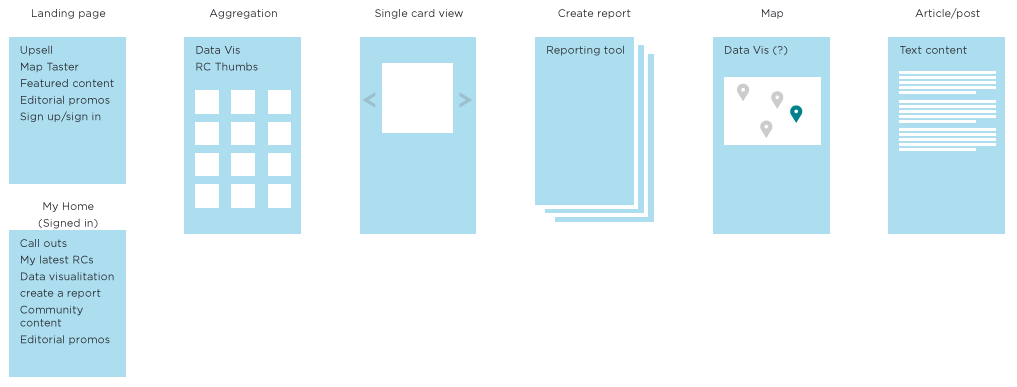
Wireframes & Flows, then Visuals
To feed the dev team with material that could be used to create the front-end interface as early as possible so we could see all the moving parts working together, we set out to create quick but high fidelity wireframes for each screen. Only then visual designs were dealt with once all wireframes had been covered. It was the first time I worked in this fashion and although it is preferable to generate the least amount of re-work or tweaks, it allowed a more compact timeline by bringing front end development earlier in the process.
UAT & issue tracking
At the final stages of the project the critical thing was to assure consistent across all modules and assets, both project specific as well as BBC patterns. On the UX side, the last month of the project was spent testing, tracking and tidying things up. For that we worked on Jira as well as a separate spreadsheet I created to track any possible item which not necessarily would have a Jira story associated with it. This also helped us in doing some prioritisation ahead of the dev team's sprint planning sessions.